

 Exide Industries
The challenge
For a high-volume battery manufacturer, plate consistency at grid casting and pasting drives yield, warranty cost, and standing with automotive customers.
The manufacturer set out to move quality from inspection after the fact to control during production: live data from every line, statistical limits that separate normal variation from real deviation, and one consistent view across battery types, shifts, and plants.
Why the customer chose AdventSys SPC
- Real-time capture straight from the gauges, with no manual entry
- Configured for each product, plate type, machine, mold, and shift
- Role-based views for operators, QA technicians, and administrators
How it works
The shop-floor workflow runs in a defined sequence:
- At the start of each shift, QA technicians assign each machine its plate type, product, mold, and operator; the system blocks a machine from being assigned twice.
- Operators log in at the workstation and capture sample weights from the weighing scale and grid thickness from vernier calipers, both connected over RS232.
- Thickness is measured at several points on each grid, including the lugs, frame, and wires.
- Every reading is stored with its time, shift, machine, mold, and operator.
Analysis
QA filters any period by date, product, plate type, shift, machine, mold, or operator, and the system produces:
- Data report: every sample's weight and thickness readings in one table.
- Run chart: weight and thickness readings in sequence against the mean, specification limits (USL, LSL), and control limits, so drift shows as it starts.
- X-bar and R chart: subgroup averages and ranges, showing shifts in the process center and in its consistency.
- Histogram: the distribution of readings across the specification range.
- Cp and Cpk: process capability calculated from the same data.
Application modules
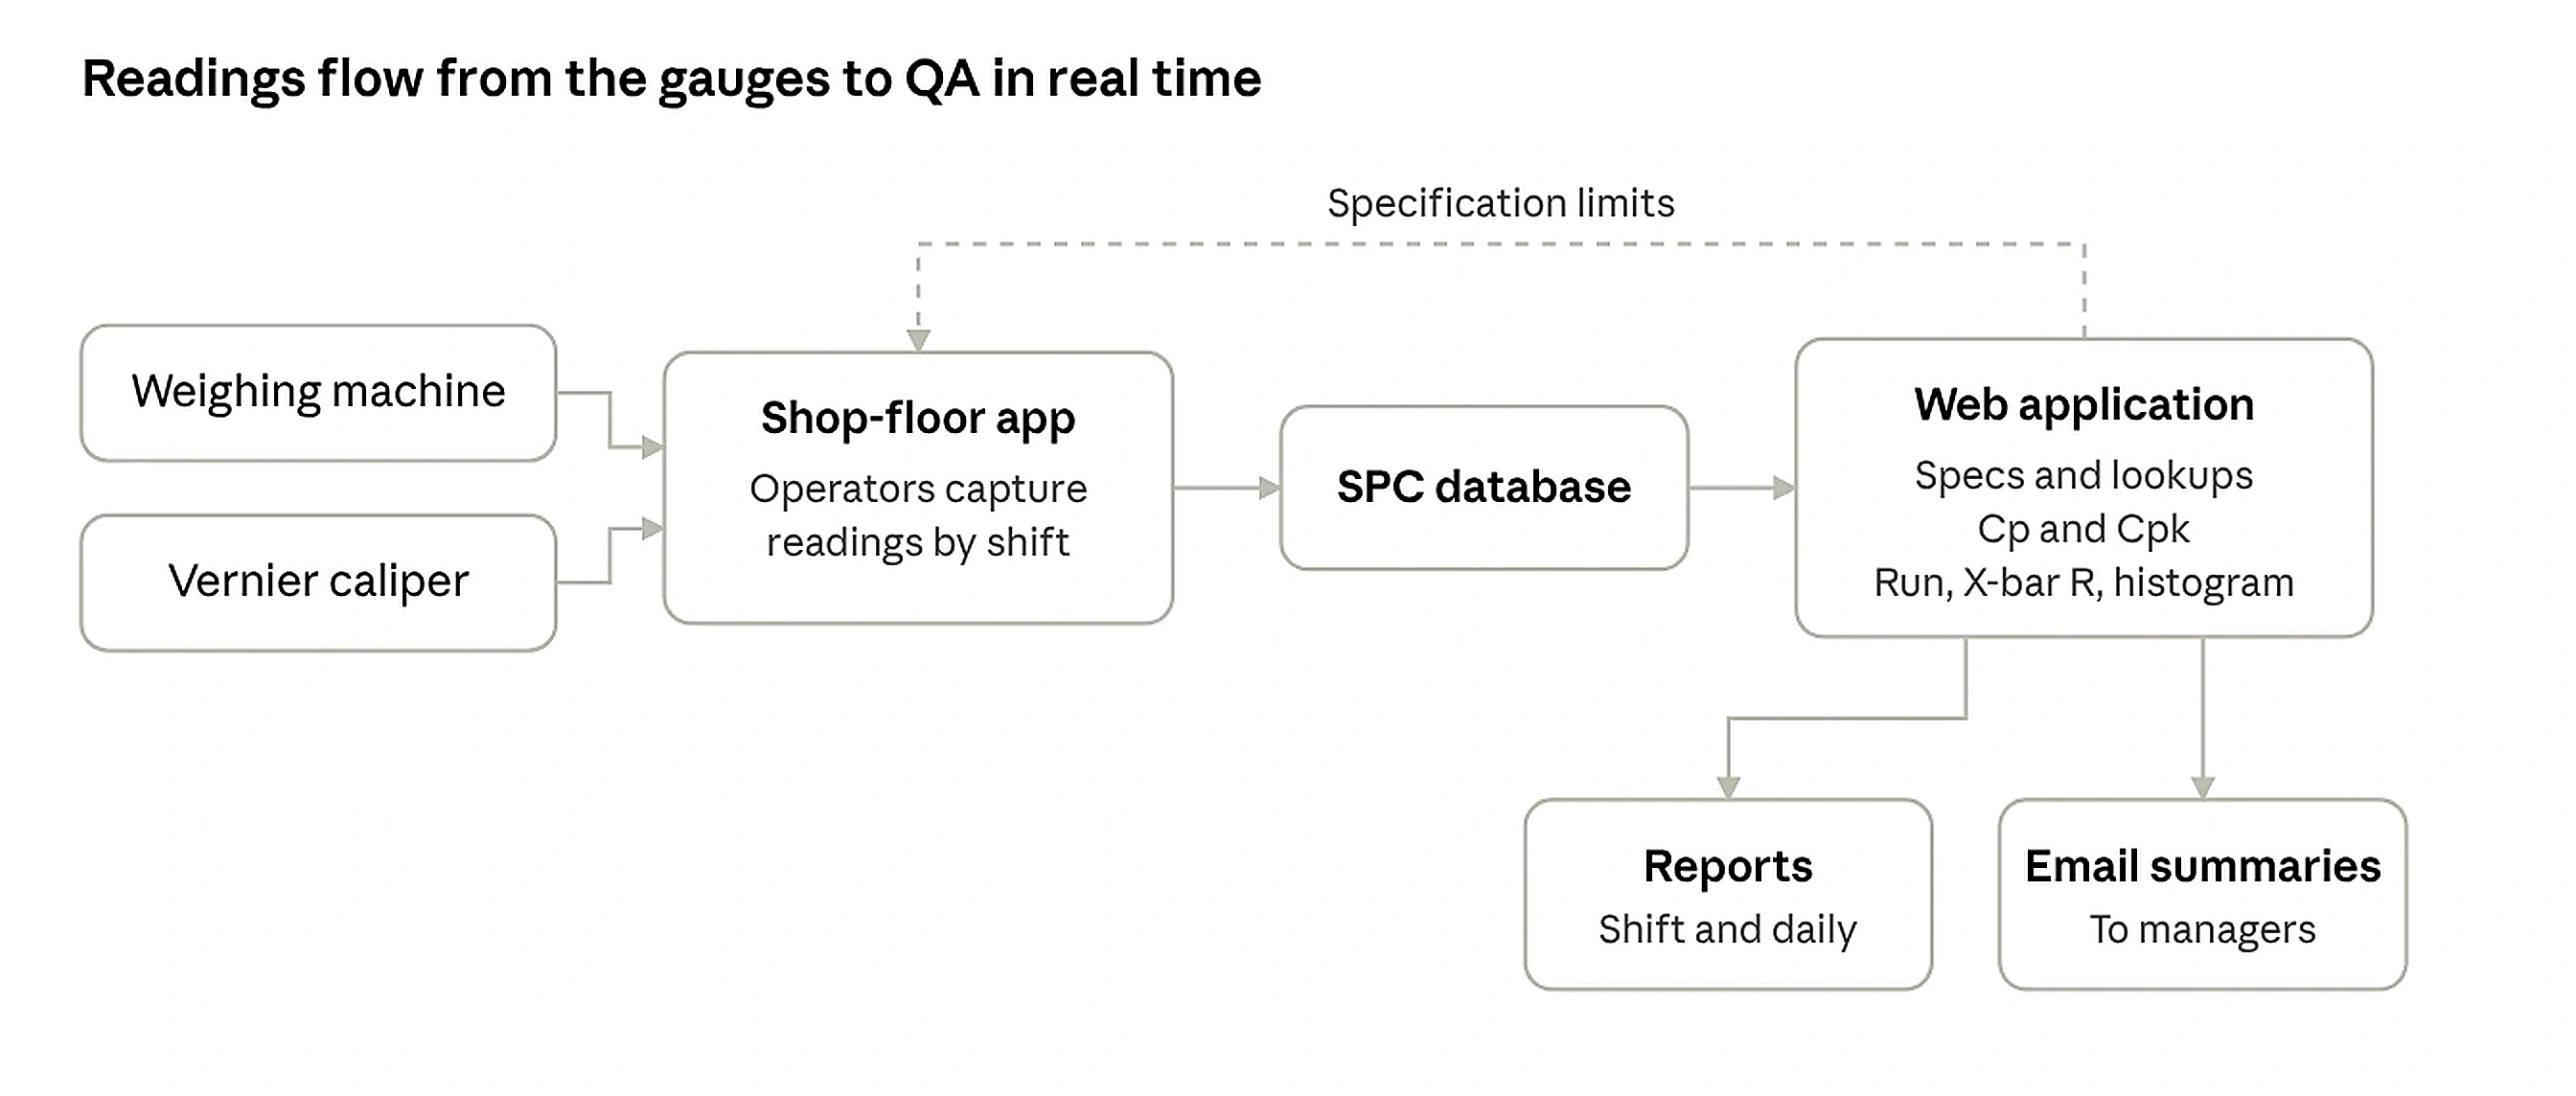
Operators capture readings at the gauges; QA sets the specification limits and reads the analysis in the web application.
Shop-floor application
Windows application at each workstation, connected to weighing scales and vernier calipers over RS232. QA technicians assign machine, plate type, product, mold, and operator for each shift; operators capture weight and thickness samples.
Users: QA technicians, machine operators
Web application
Masters for machines, shifts, products, molds, employees, users, and gauge port settings. SPC analysis with the data report, run chart, X-bar and R chart, histogram, and Cp and Cpk.
Users: QA technicians, administrators
Email summaries
Sends SPC summary reports to managers by email.
Users: Managers
Reports
Data reports and charts filtered by date, product, plate type, shift, machine, mold, and operator, with export.
Users: QA technicians, administrators
Benefits
- Process drift corrected mid-shift, before it becomes scrap
- Fewer rejections and warranty claims
- Less lead and paste wasted
- No manual quality records
- Audit-ready quality data across lines, shifts, and plants